EduFarming
Your list · 0हिं

Type at least two letters. Press Esc to close.

↑↓ navigate↵ openTAB cycle filter

Data Interpretation · Question 54 of 75

Taking the two Bhopal clinics in the graph together, in which year did the total number of patients rise by…

Question 54

HardOriginal question

Taking the two Bhopal clinics in the graph together, in which year did the total number of patients rise by the largest percentage over the year before?
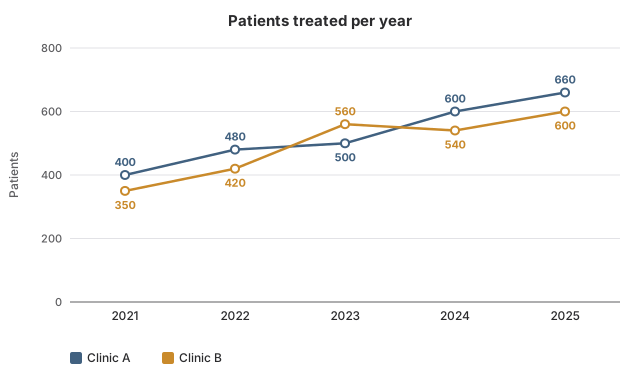
Line graph with two lines titled Patients treated per year. Clinic A: 2021 400 patients; 2022 480 patients; 2023 500 patients; 2024 600 patients; 2025 660 patients. Clinic B: 2021 350 patients; 2022 420 patients; 2023 560 patients; 2024 540 patients; 2025 600 patients.
Options for question 54

Show the answer and explanation
CorrectNot quiteAnswer A

Correct answer: A

Explanation

  1. Combined totals: 2021: 750, 2022: 900, 2023: 1,060, 2024: 1,140, 2025: 1,260.

  2. 2022: 150750=20%\frac{150}{750} = 20\%. 2023: 160900≈17.8%\frac{160}{900} \approx 17.8\%.

  3. 2024: 801,060≈7.5%\frac{80}{1{,}060} \approx 7.5\%. 2025: 1201,140≈10.5%\frac{120}{1{,}140} \approx 10.5\%. The largest is 2022.

Worth noting

2023 has the largest rise in numbers (160), but on a base of 900 that is only about 17.8%, less than 2022's 20%.

Concept
Largest percentage rise versus largest absolute rise
Typical time
120 s
Your time
—
The rule this testsLine graphs
Practise this chapter →

Ten questions from Data Interpretation, at your own pace.

Practise this chapter →

Ten questions from Data Interpretation, at your own pace.