Question 41
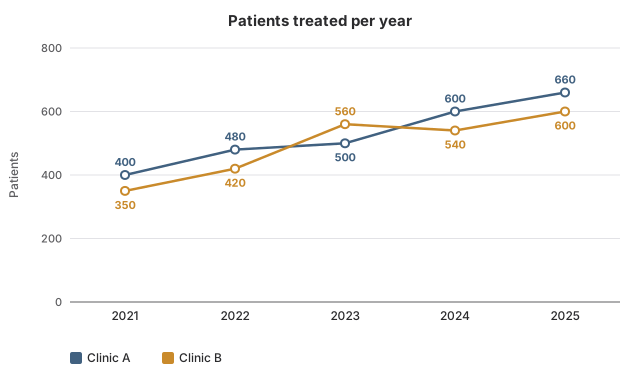
EasyOriginal questionThe graph compares two clinics in Bhopal by the patients they saw each year. In which year did Clinic B treat more patients than Clinic A?
Show the answer and explanation
CorrectNot quiteAnswer C
Correct answer: C
Explanation
Compare the two lines year by year: Clinic A is higher in 2021, 2022, 2024 and 2025.
Only in 2023 is Clinic B higher: 560 against 500.
Worth noting
In 2024 Clinic B (540) was below Clinic A (600) again.
- Concept
- Spotting where two lines cross
- Typical timeTypical
- 45 s
- Your timeYours
- —
Practise this chapter →
Ten questions from Data Interpretation, at your own pace.