Question 42
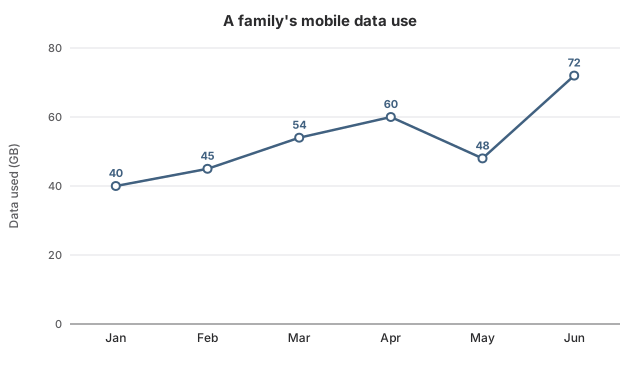
EasyOriginal questionThe graph shows how many gigabytes of mobile data a family used in each of six months. In which month did the family use less data than in the month before?
Show the answer and explanation
CorrectNot quiteAnswer A
Correct answer: A
Explanation
Monthly use: 40, 45, 54, 60, 48, 72 GB.
The only fall is from April (60 GB) to May (48 GB).
Worth noting
June has the steepest part of the line, but it is a rise, from 48 GB to 72 GB.
- Concept
- Spotting a fall on a line graph
- Typical timeTypical
- 45 s
- Your timeYours
- —
Practise this chapter →
Ten questions from Data Interpretation, at your own pace.