EduFarming
Your list · 0हिं

Type at least two letters. Press Esc to close.

↑↓ navigate↵ openTAB cycle filter

Data Interpretation · Question 29 of 75

From the chart of cycles sold at the Ludhiana shop, what is the ratio of sales in January–March to sales in…

Question 29

MediumOriginal question

From the chart of cycles sold at the Ludhiana shop, what is the ratio of sales in January–March to sales in April–June?
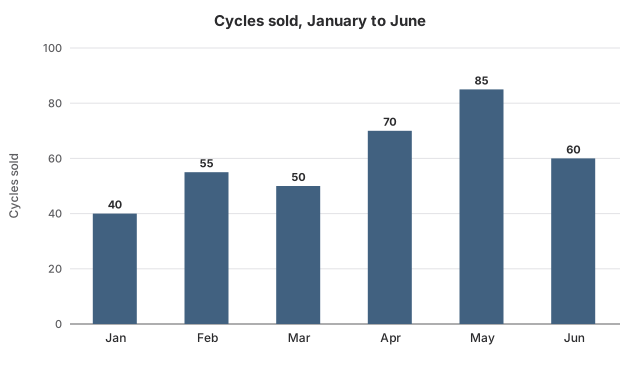
Bar chart titled Cycles sold, January to June. January: 40 cycles; February: 55 cycles; March: 50 cycles; April: 70 cycles; May: 85 cycles; June: 60 cycles.
Options for question 29

Show the answer and explanation
CorrectNot quiteAnswer D

Correct answer: D

Explanation

  1. January–March: 40+55+50=14540 + 55 + 50 = 145.

  2. April–June: 70+85+60=21570 + 85 + 60 = 215.

  3. 145:215145 : 215; divide both by 5 to get 29:4329 : 43.

Worth noting

43:2943 : 29 is the ratio the wrong way round. 29:7229 : 72 compares the first three months with all six months. 3:43 : 4 is a rough guess from the bar heights; 145:215145 : 215 does not simplify to it.

Concept
Ratio of two group totals
Typical time
80 s
Your time
—
The rule this testsBar graphs
Practise this chapter →

Ten questions from Data Interpretation, at your own pace.

Practise this chapter →

Ten questions from Data Interpretation, at your own pace.