Question 21
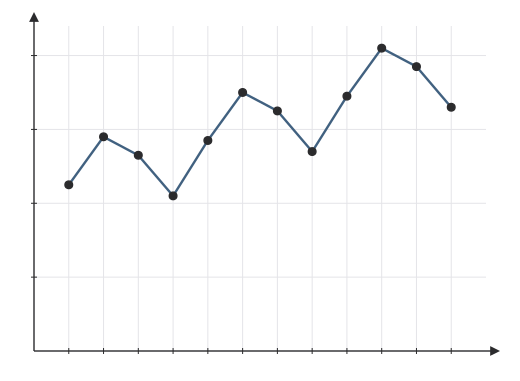
MediumOriginal questionThe graph shows a shop's sales , in lakh rupees, for 12 quarters in a row, three years in all. Which components does it show most clearly?
Show the answer and explanation
CorrectNot quiteAnswer B
Correct answer: B
Explanation
Across the three years the sales climb: each quarter is higher than the same quarter a year before. That is an upward trend.
Within each year the same pattern repeats, a peak in the second quarter and a dip in the fourth: seasonal variation.
Worth noting
The ups and downs come back every four quarters, so they are seasonal, not irregular.
- Concept
- Reading components from a graph
- Typical timeTypical
- 90 s
- Your timeYours
- —
Practise this chapter →
Ten questions from Time Series & Trend, at your own pace.