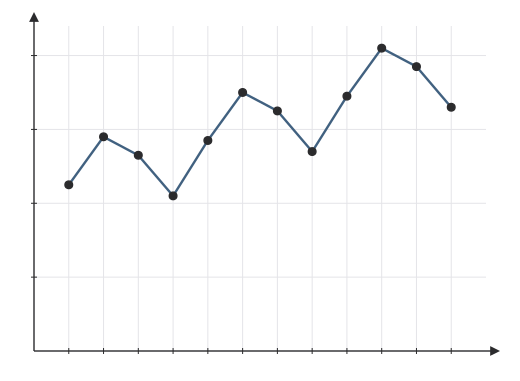
On this page · 9 sections 01 What a time series is 02 Components of a time series 03 Trend by moving averages 04 A straight-line trend by least squares 05 How CUET asks this chapter 06 Exam shortcuts 07 Common mistakes 08 Quick revision 09 Check your understanding A cycle shop has kept its yearly sales since 2019. The numbers go up most years, dip in some, and the owner wants to know the underlying direction so as to plan stock for 2025. Reading that direction out of data recorded over time is the subject of this chapter.
A time series is a set of values of one variable recorded at successive points of time, in time order: yearly sales, monthly rainfall, daily prices. Time is the independent variable and the recorded value depends on it; a series with one variable is called univariate.
There are four. The secular trend is the long-term tendency to rise or fall over many years. Seasonal variation is a pattern that repeats within a year, tied to seasons, festivals or customs. Cyclical variation is a slow rise and fall over more than a year, as in a business cycle. Irregular variation comes from one-off, unforeseen events such as floods or strikes.
Both seasonal and cyclical variation repeat, but seasonal variation repeats within a year, while a cycle lasts longer than a year and has no fixed length.
Average each run of k k k
Example 1 · A 3-year moving average
The shop's sales, in lakh rupees, for 2019 to 2023 are 8, 10, 13, 14 and 15. Find the 3-year moving averages.
8 + 10 + 13 3 = 31 3 ≈ 10.33 \frac{8 + 10 + 13}{3} = \frac{31}{3} \approx 10.33 3 8 + 10 + 13 = 3 31 ≈ 10.33
Then 10 + 13 + 14 3 = 37 3 ≈ 12.33 \frac{10 + 13 + 14}{3} = \frac{37}{3} \approx 12.33 3 10 + 13 + 14 = 3 37 ≈ 12.33 13 + 14 + 15 3 = 14 \frac{13 + 14 + 15}{3} = 14 3 13 + 14 + 15 = 14
Answer 10.33, 12.33 and 14, for 2020, 2021 and 2022.
With an even period, such as 4 years, each average falls between two years; averaging neighbouring pairs, called centring, puts the values against years again.
Fit y = a + b x y = a + bx y = a + b x ∑ y = n a + b ∑ x \sum y = na + b\sum x ∑ y = na + b ∑ x ∑ x y = a ∑ x + b ∑ x 2 \sum xy = a\sum x + b\sum x^{2} ∑ x y = a ∑ x + b ∑ x 2 x x x ∑ x = 0 \sum x = 0 ∑ x = 0 a = ∑ y n a = \frac{\sum y}{n} a = n ∑ y b = ∑ x y ∑ x 2 b = \frac{\sum xy}{\sum x^{2}} b = ∑ x 2 ∑ x y
Example 2 · The shop's trend line
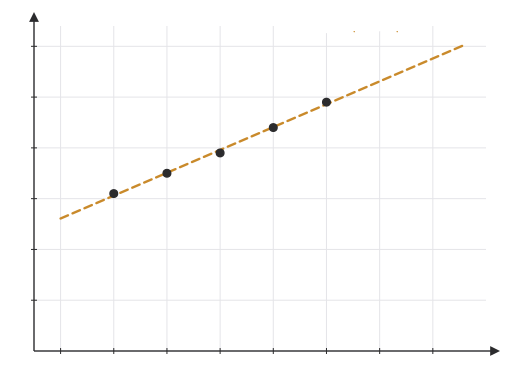
Fit a straight-line trend to the sales 8, 10, 13, 14, 15 for 2019 to 2023, and estimate the trend for 2025.
With x = − 2 , − 1 , 0 , 1 , 2 x = -2, -1, 0, 1, 2 x = − 2 , − 1 , 0 , 1 , 2 ∑ y = 60 \sum y = 60 ∑ y = 60 ∑ x y = − 16 − 10 + 0 + 14 + 30 = 18 \sum xy = -16 - 10 + 0 + 14 + 30 = 18 ∑ x y = − 16 − 10 + 0 + 14 + 30 = 18 ∑ x 2 = 10 \sum x^{2} = 10 ∑ x 2 = 10
a = 60 5 = 12 a = \frac{60}{5} = 12 a = 5 60 = 12 b = 18 10 = 1.8 b = \frac{18}{10} = 1.8 b = 10 18 = 1.8 y = 12 + 1.8 x y = 12 + 1.8x y = 12 + 1.8 x x = 4 x = 4 x = 4 y = 12 + 7.2 = 19.2 y = 12 + 7.2 = 19.2 y = 12 + 7.2 = 19.2
Answer y = 12 + 1.8 x y = 12 + 1.8x y = 12 + 1.8 x x x x
The slope b b b a a a
Time series: which data form one, which variable is independent.Components: name the component behind an example, or read them from a graph.Moving averages: a 3-year or centred 4-year average, how many there are, where each is placed.Least squares: a a a b b b
Seasonal: within a year; cyclical: longer than a year; trend: long-term; irregular: one-off.
n n n n − k + 1 n - k + 1 n − k + 1 k k k x x x a = y ˉ a = \bar{y} a = y ˉ b = ∑ x y ∑ x 2 b = \frac{\sum xy}{\sum x^{2}} b = ∑ x 2 ∑ x y Count x x x
Calling a yearly pattern cyclical.
Placing a moving average against the last year of its run.
Dividing ∑ x y \sum xy ∑ x y n n n ∑ x 2 \sum x^{2} ∑ x 2
Reading the slope as a percentage growth.
Components
Trend, seasonal, cyclical, irregular
Seasonal within a year, cyclical over years
Measuring trend
Moving average: middle of its run
Least squares: y = a + b x y = a + bx y = a + b x a = y ˉ a = \bar{y} a = y ˉ b = ∑ x y ∑ x 2 b = \frac{\sum xy}{\sum x^{2}} b = ∑ x 2 ∑ x y
Next in Section B2: learning about a whole population from a sample, in sampling, inference and the t-test .
Next · 08 Quick revision → Check your understanding 68 questions, grouped by type, easy to hard. Pick an answer and check it. The worked solution opens when you ask for it.
What a time series is Q1 of 68 Q1
What a time series is 7 questions Which of these is a time series?
Options for question 1 A Option A The marks of 40 students in one test B Option B India's rice output for each year from 2015 to 2025 C Option C The heights of the players in a team D Option D The populations of ten states in 2021
Skip Check Show the explanation Hide the explanation Next question Try again
Show the explanation Hide the explanation Answer B · India's rice output for each year from 2015 to 2025
A time series records one quantity at successive points of time, in time order.
Rice output year by year is such a record. The others compare different students, players or states at a single time.
Worth noting
The ten states' populations carry a year, but it is one year for all of them: the data run across places, not through time.
In a time series, which is the independent variable?
Options for question 2 A Option A The value recorded B Option B The trend C Option C The average of the values D Option D Time
Skip Check Show the explanation Hide the explanation Next question Try again
Show the explanation Hide the explanation Answer D · Time
The values are recorded against time, which runs on regardless.
So time is the independent variable, and the value recorded depends on it.
Worth noting
The value recorded is the dependent variable, plotted on the vertical axis.
Read the two statements and choose the correct option.
I. A time series is data arranged in the order of time.
II. A univariate time series records one variable over time.
Options for question 3 A Option A Only I B Option B Only II C Option C Both I and II D Option D Neither I nor II
Skip Check Show the explanation Hide the explanation Next question Try again
Show the explanation Hide the explanation Answer C · Both I and II
I: chronological order is what makes data a time series. True.
II: 'univariate' means a single variable, such as yearly sales. True.
Which of these is NOT a time series?
Options for question 4 A Option A A city's rainfall each month for five years B Option B The marks of 40 students in one test C Option C A company's yearly profits from 2015 to 2025 D Option D The price of gold on each day of a month
Skip Check Show the explanation Hide the explanation Next question Try again
Show the explanation Hide the explanation Answer B · The marks of 40 students in one test
A time series records one quantity at successive points of time.
The test marks are 40 different students at one moment, not one quantity over time.
When a time series is plotted, where does time usually go?
Options for question 5 A Option A On the vertical axis B Option B On the horizontal axis C Option C On both axes D Option D It is not shown
Skip Check Show the explanation Hide the explanation Next question Try again
Show the explanation Hide the explanation Answer B · On the horizontal axis
Time is the independent variable, so it goes along the horizontal axis.
The quantity measured goes on the vertical axis.
Which of these describes a univariate time series?
Options for question 6 A Option A The values of several variables at one moment B Option B Two variables recorded against each other C Option C Values listed in order of size D Option D The values of one variable recorded over time
Skip Check Show the explanation Hide the explanation Next question Try again
Show the explanation Hide the explanation Answer D · The values of one variable recorded over time
'Univariate' means one variable; a time series records it at successive times.
So a univariate time series is one variable, such as monthly sales, followed through time.
Worth noting
Ordering values by size destroys the time order, which is the whole point of a time series.
Read the two statements and choose the correct option.
I. Studying a time series helps to forecast future values.
II. The order of the observations does not matter in a time series.
Options for question 7 A Option A Only I B Option B Only II C Option C Both I and II D Option D Neither I nor II
Skip Check Show the explanation Hide the explanation Next question Try again
Show the explanation Hide the explanation Answer A · Only I
I: the pattern of the past, such as a trend, is projected forward. True.
II: a time series is defined by its time order; shuffling it loses the trend and seasons. False.
Components of a time series 19 questions Sales of woollen clothes rise every winter and fall every summer. Which component of a time series is this?
Options for question 8 A Option A Seasonal variation B Option B Secular trend C Option C Cyclical variation D Option D Irregular variation
Skip Check Show the explanation Hide the explanation Next question Try again
Show the explanation Hide the explanation Answer A · Seasonal variation
A pattern that repeats within a year, tied to the seasons, festivals or customs, is seasonal variation.
Winter demand for woollens comes back every year.
Worth noting
Cyclical variation also repeats, but over several years, not within one.
India's population has grown steadily over the last fifty years. Which component of a time series is this?
Options for question 9 A Option A Secular trend B Option B Seasonal variation C Option C Cyclical variation D Option D Irregular variation
Skip Check Show the explanation Hide the explanation Next question Try again
Show the explanation Hide the explanation Answer A · Secular trend
The secular trend is the general tendency of a series to rise or fall over a long period.
Steady growth over fifty years is a long-term rise.
Worth noting
Cyclical variation rises and then falls again; a trend keeps its direction.
A shop's sales fall for one week because of a sudden transport strike. Which component of a time series is this?
Options for question 10 A Option A Secular trend B Option B Seasonal variation C Option C Irregular variation D Option D Cyclical variation
Skip Check Show the explanation Hide the explanation Next question Try again
Show the explanation Hide the explanation Answer C · Irregular variation
A sudden, unpredictable one-off change is irregular variation.
So this is irregular variation.
Ice-cream sales in a town peak every May and June and fall every December. Which component of a time series is this?
Options for question 11 A Option A Secular trend B Option B Cyclical variation C Option C Irregular variation D Option D Seasonal variation
Skip Check Show the explanation Hide the explanation Next question Try again
Show the explanation Hide the explanation Answer D · Seasonal variation
A pattern that repeats regularly within a fixed short period is seasonal variation.
So this is seasonal variation.
The number of mobile internet users in India has risen year after year for fifteen years. Which component of a time series is this?
Options for question 12 A Option A Secular trend B Option B Seasonal variation C Option C Cyclical variation D Option D Irregular variation
Skip Check Show the explanation Hide the explanation Next question Try again
Show the explanation Hide the explanation Answer A · Secular trend
A steady movement in one direction over a long period is the secular trend.
So this is secular trend.
Assertion (A): A sudden drop in a factory's output caused by an earthquake is irregular variation.
Reason (R): Irregular variations are unpredictable and follow no regular pattern.
Options for question 13 A Option A Both A and R are true, and R is the correct explanation of A. B Option B Both A and R are true, but R is not the correct explanation of A. C Option C A is true, but R is false. D Option D A is false, but R is true.
Skip Check Show the explanation Hide the explanation Next question Try again
Show the explanation Hide the explanation Answer A · Both A and R are true, and R is the correct explanation of A.
R is the description of irregular variation. True.
An earthquake is unpredictable and does not repeat on a schedule, so A is true because of R.
A two-wheeler maker studies its monthly sales from 2010 to 2025. It notes four features: sales jump every October and November in the festival season; over the fifteen years they climb steadily as incomes rise; they sag for two or three years at a stretch when the wider economy slows, then recover; and they collapsed in April 2020 when a nationwide lockdown shut its showrooms.
Which component is the two-wheeler maker's festive jump each October and November?
Options for question 14 A Option A Seasonal variation B Option B Secular trend C Option C Cyclical variation D Option D Irregular variation
Skip Check Show the explanation Hide the explanation Next question Try again
Show the explanation Hide the explanation Answer A · Seasonal variation
It comes back at the same time every year.
A movement that repeats within each year is seasonal.
Worth noting
It is not irregular: it can be predicted from the calendar.
A two-wheeler maker studies its monthly sales from 2010 to 2025. It notes four features: sales jump every October and November in the festival season; over the fifteen years they climb steadily as incomes rise; they sag for two or three years at a stretch when the wider economy slows, then recover; and they collapsed in April 2020 when a nationwide lockdown shut its showrooms.
Which component is the two-wheeler maker's steady climb over the fifteen years?
Options for question 15 A Option A Seasonal variation B Option B Cyclical variation C Option C Irregular variation D Option D Secular trend
Skip Check Show the explanation Hide the explanation Next question Try again
Show the explanation Hide the explanation Answer D · Secular trend
It is the general direction over a long period.
That is the secular trend.
Worth noting
A cyclical movement rises and falls; this rise keeps going.
A two-wheeler maker studies its monthly sales from 2010 to 2025. It notes four features: sales jump every October and November in the festival season; over the fifteen years they climb steadily as incomes rise; they sag for two or three years at a stretch when the wider economy slows, then recover; and they collapsed in April 2020 when a nationwide lockdown shut its showrooms.
Which component is the collapse in the two-wheeler maker's sales in April 2020?
Options for question 16 A Option A Secular trend B Option B Seasonal variation C Option C Irregular variation D Option D Cyclical variation
Skip Check Show the explanation Hide the explanation Next question Try again
Show the explanation Hide the explanation Answer C · Irregular variation
It was caused by a one-off event that could not have been foreseen from the pattern.
That is irregular variation.
Worth noting
It is not cyclical: it did not grow out of the business cycle.
A factory's output drops sharply one month because a flood cuts it off. Which component of a time series is this?
Options for question 17 A Option A Secular trend B Option B Irregular variation C Option C Seasonal variation D Option D Cyclical variation
Skip Check Show the explanation Hide the explanation Next question Try again
Show the explanation Hide the explanation Answer B · Irregular variation
Irregular variation comes from unforeseen, one-off events such as floods, strikes or wars.
It follows no pattern and cannot be predicted.
Worth noting
A flood may come in the rainy season, but this drop is not a yearly pattern, so it is not seasonal.
A country's business activity goes through booms and slumps that repeat roughly every 7 to 10 years. Which component of a time series is this?
Options for question 18 A Option A Secular trend B Option B Seasonal variation C Option C Irregular variation D Option D Cyclical variation
Skip Check Show the explanation Hide the explanation Next question Try again
Show the explanation Hide the explanation Answer D · Cyclical variation
Cyclical variation is a wave-like rise and fall lasting more than a year, as in the business cycle.
Booms and slumps over 7 to 10 years are exactly that.
Worth noting
Seasonal variation repeats within a single year.
Match each example in List I with the component of a time series in List II.
List I List II A. Ice-cream sales peak every May I. Irregular variation B. Car ownership rising over 30 years II. Seasonal variation C. Exports hit by a sudden strike at a port III. Cyclical variation D. Investment rising and falling over a decade IV. Secular trend
Options for question 19 A Option A A-IV, B-II, C-I, D-III B Option B A-II, B-IV, C-III, D-I C Option C A-II, B-IV, C-I, D-III D Option D A-IV, B-II, C-III, D-I
Skip Check Show the explanation Hide the explanation Next question Try again
Show the explanation Hide the explanation Answer C · A-II, B-IV, C-I, D-III
A yearly peak is seasonal; a 30-year rise is the trend.
A sudden strike is irregular; a rise and fall over a decade is cyclical.
Read the two statements and choose the correct option.
I. Seasonal variations repeat within a year.
II. Cyclical variations repeat at regular intervals of less than a year.
Options for question 20 A Option A Only I B Option B Only II C Option C Both I and II D Option D Neither I nor II
Skip Check Show the explanation Hide the explanation Next question Try again
Show the explanation Hide the explanation Answer A · Only I
I: seasons, festivals and harvests come round every year. True.
II: cycles last more than a year, and their length is not fixed. False.
The graph shows a shop's sales y y y t t t
Options for question 21 A Option A A falling trend with cyclical variation B Option B A rising trend with seasonal variation C Option C Only irregular variation D Option D A rising trend and nothing else
Skip Check Show the explanation Hide the explanation Next question Try again
Show the explanation Hide the explanation Answer B · A rising trend with seasonal variation
Across the three years the sales climb: each quarter is higher than the same quarter a year before. That is an upward trend.
Within each year the same pattern repeats, a peak in the second quarter and a dip in the fourth: seasonal variation.
Worth noting
The ups and downs come back every four quarters, so they are seasonal, not irregular.
Traffic on a city road peaks every morning and every evening. Which component of a time series is this?
Options for question 22 A Option A Secular trend B Option B Cyclical variation C Option C Irregular variation D Option D Seasonal variation
Skip Check Show the explanation Hide the explanation Next question Try again
Show the explanation Hide the explanation Answer D · Seasonal variation
A pattern that repeats regularly within a fixed short period is seasonal variation.
So this is seasonal variation.
Worth noting
Seasonal variation is any regular pattern within a fixed short period, a day or a week as well as a year.
Sales of landline phones have fallen steadily for twenty years. Which component of a time series is this?
Options for question 23 A Option A Secular trend B Option B Seasonal variation C Option C Cyclical variation D Option D Irregular variation
Skip Check Show the explanation Hide the explanation Next question Try again
Show the explanation Hide the explanation Answer A · Secular trend
A steady movement in one direction over a long period is the secular trend.
So this is secular trend.
Worth noting
A trend can fall as well as rise; what makes it a trend is the long, steady direction.
Property prices in a city rise for several years, then fall, then rise again, over periods of about eight years. Which component of a time series is this?
Options for question 24 A Option A Secular trend B Option B Cyclical variation C Option C Seasonal variation D Option D Irregular variation
Skip Check Show the explanation Hide the explanation Next question Try again
Show the explanation Hide the explanation Answer B · Cyclical variation
Rises and falls that repeat over several years are cyclical variation.
So this is cyclical variation.
Worth noting
Cyclical swings last longer than a year; seasonal ones repeat within a year.
Which of the following are true of the secular trend?
I. It describes the long-term movement of the series.
II. It shows the smooth general direction, ignoring short ups and downs.
III. It repeats within each year.
IV. It may be rising, falling or steady.
Options for question 25 A Option A All four: I, II, III and IV B Option B I and II only C Option C I, II and IV only D Option D II and IV only
Skip Check Show the explanation Hide the explanation Next question Try again
Show the explanation Hide the explanation Answer C · I, II and IV only
The trend is the long-run, smoothed direction of a series, upward, downward or flat.
III describes seasonal variation, not the trend.
A two-wheeler maker studies its monthly sales from 2010 to 2025. It notes four features: sales jump every October and November in the festival season; over the fifteen years they climb steadily as incomes rise; they sag for two or three years at a stretch when the wider economy slows, then recover; and they collapsed in April 2020 when a nationwide lockdown shut its showrooms.
Which component is the two-wheeler maker's sag of two or three years when the economy slows?
Options for question 26 A Option A Cyclical variation B Option B Secular trend C Option C Seasonal variation D Option D Irregular variation
Skip Check Show the explanation Hide the explanation Next question Try again
Show the explanation Hide the explanation Answer A · Cyclical variation
It lasts more than a year and follows the ups and downs of the economy.
Booms and slumps of this kind are cyclical variation.
Worth noting
It is not seasonal: a season repeats within a year, while this swing takes years.
Trend by moving averages 19 questions A firm's profits, in lakh rupees, for five years are 12, 15, 18, 15 and 21. What is the first 3-year moving average?
Options for question 27 A Option A 15 15 15 B Option B 16 16 16 C Option C 16.2 16.2 16.2 D Option D 18 18 18
Skip Check Show the explanation Hide the explanation Next question Try again
Show the explanation Hide the explanation Answer A · 15 15 15
The first 3-year moving average is the mean of the first three values.
12 + 15 + 18 3 = 15 \frac{12 + 15 + 18}{3} = 15 3 12 + 15 + 18 = 15
Worth noting
16.2 is the mean of all five years, not a moving average.
The first 3-year moving average is found from the values for 2019, 2020 and 2021. Against which year is it placed?
Options for question 28 A Option A 2019 B Option B 2020 C Option C 2021 D Option D 2022
Skip Check Show the explanation Hide the explanation Next question Try again
Show the explanation Hide the explanation Answer B · 2020
A moving average of an odd number of years is placed against the middle year of its group.
The middle of 2019, 2020 and 2021 is 2020.
Worth noting
2021 is the last year of the group; the average describes its centre.
The first 3-year moving average of the values 12, x x x x x x
Options for question 29 A Option A 13 13 13 B Option B 14 14 14 C Option C 15 15 15 D Option D 18 18 18
Skip Check Show the explanation Hide the explanation Next question Try again
Show the explanation Hide the explanation Answer C · 15 15 15
12 + x + 18 3 = 15 \frac{12 + x + 18}{3} = 15 3 12 + x + 18 = 15 30 + x = 45 30 + x = 45 30 + x = 45
x = 15 x = 15 x = 15
Worth noting
45 is the sum of the three values, not x x x
A firm's profits, in lakh rupees, for five years are 20, 26, 23, 29 and 32. What is the first 3-year moving average?
Options for question 30 A Option A 22 22 22 B Option B 23 23 23 C Option C 26 26 26 D Option D 28 28 28
Skip Check Show the explanation Hide the explanation Next question Try again
Show the explanation Hide the explanation Answer B · 23 23 23
The first 3-year moving average uses 20 , 26 , 23 20, 26, 23 20 , 26 , 23
20 + 26 + 23 3 = 23 \frac{20 + 26 + 23}{3} = 23 3 20 + 26 + 23 = 23
Worth noting
26 is the middle value, not the average of the three.
A 5-year moving average is worked out from the values for 2016 to 2020. Against which year is it placed?
Options for question 31 A Option A 2,015 2{,}015 2 , 015 B Option B 2016 C Option C 2017 D Option D 2018
Skip Check Show the explanation Hide the explanation Next question Try again
Show the explanation Hide the explanation Answer D · 2018
A moving average is placed against the middle of its period.
The middle of 2016 to 2020 is 2018.
Worth noting
Placing it against the last year, 2020, makes the averages lag behind the data.
A firm's profits, in lakh rupees, for five years are 20, 26, 23, 29 and 32. What is the last 3-year moving average?
Options for question 32 A Option A 23 23 23 B Option B 26 26 26 C Option C 28 28 28 D Option D 30.5 30.5 30.5
Skip Check Show the explanation Hide the explanation Next question Try again
Show the explanation Hide the explanation Answer C · 28 28 28
The last 3-year moving average uses 23 , 29 , 32 23, 29, 32 23 , 29 , 32
23 + 29 + 32 3 = 28 \frac{23 + 29 + 32}{3} = 28 3 23 + 29 + 32 = 28
Worth noting
26 is the average of all five years.
A hill resort's guests, in hundreds, for the four quarters of two years were: year 1: 12, 30, 8, 20; year 2: 14, 33, 9, 24.
Which component stands out most clearly in the resort's guest numbers?
Options for question 33 A Option A Secular trend B Option B Cyclical variation C Option C Irregular variation D Option D Seasonal variation
Skip Check Show the explanation Hide the explanation Next question Try again
Show the explanation Hide the explanation Answer D · Seasonal variation
Both years peak in the second quarter and dip in the third, the same pattern inside each year.
A pattern that repeats within a year is seasonal variation.
Worth noting
A small rise from year 1 to year 2 hints at a trend, but the quarter-to-quarter swing is far larger.
A hill resort's guests, in hundreds, for the four quarters of two years were: year 1: 12, 30, 8, 20; year 2: 14, 33, 9, 24.
What is the first 4-quarter moving total of the resort's guests?
Options for question 34 A Option A 50 50 50 B Option B 70 70 70 C Option C 72 72 72 D Option D 76 76 76
Skip Check Show the explanation Hide the explanation Next question Try again
Show the explanation Hide the explanation Answer B · 70 70 70
The first moving total adds the four quarters of year 1.
12 + 30 + 8 + 20 = 70 12 + 30 + 8 + 20 = 70 12 + 30 + 8 + 20 = 70
Worth noting
72 is the second total, starting from the second quarter.
A time series has values for 7 years. How many 3-year moving averages can be worked out from it?
Options for question 35 A Option A 3 3 3 B Option B 4 4 4 C Option C 5 5 5 D Option D 7 7 7
Skip Check Show the explanation Hide the explanation Next question Try again
Show the explanation Hide the explanation Answer C · 5 5 5
The groups are years 1–3, 2–4, 3–5, 4–6 and 5–7.
That is 7 − 3 + 1 = 5 7 - 3 + 1 = 5 7 − 3 + 1 = 5
Worth noting
7 would give every year a trend value, but the first and last years have no year on one side.
Read the two statements and choose the correct option.
I. A moving average smooths out short-term ups and downs to show the trend.
II. A 3-year moving average gives a trend value for the first and the last year as well.
Options for question 36 A Option A Only I B Option B Only II C Option C Both I and II D Option D Neither I nor II
Skip Check Show the explanation Hide the explanation Next question Try again
Show the explanation Hide the explanation Answer A · Only I
I: averaging neighbouring years cancels out much of the short-term change. True.
II: the first and last years have no neighbour on one side, so they get no 3-year average. False.
A school's enrolment, in hundreds, over six years is 11, 12, 16, 17, 19 and 22. What is the first 5-year moving average?
Options for question 37 A Option A 15 15 15 B Option B 16 16 16 C Option C 17 17 17 D Option D 17.2 17.2 17.2
Skip Check Show the explanation Hide the explanation Next question Try again
Show the explanation Hide the explanation Answer A · 15 15 15
The first 5-year moving average uses 11 , 12 , 16 , 17 , 19 11, 12, 16, 17, 19 11 , 12 , 16 , 17 , 19
11 + 12 + 16 + 17 + 19 5 = 15 \frac{11 + 12 + 16 + 17 + 19}{5} = 15 5 11 + 12 + 16 + 17 + 19 = 15
Worth noting
16 is the middle value of the first five, not their average.
A shop's sales are recorded every quarter, and they rise and fall in the same way each year. Which moving average best removes this seasonal pattern?
Options for question 38 A Option A A 3-quarter moving average B Option B A 2-quarter moving average C Option C A 6-quarter moving average D Option D A 4-quarter moving average
Skip Check Show the explanation Hide the explanation Next question Try again
Show the explanation Hide the explanation Answer D · A 4-quarter moving average
A moving average removes a regular pattern when its period equals the pattern's length.
The pattern repeats every 4 quarters, so each 4-quarter average contains one of each quarter.
Worth noting
A 3-quarter average always leaves out one quarter, so the seasonal effect stays.
A town's water use, in lakh litres, over five years is 40, 46, 43, 52 and 55. What is the second 3-year moving average?
Options for question 39 A Option A 43 43 43 B Option B 47 47 47 C Option C 48 48 48 D Option D 50 50 50
Skip Check Show the explanation Hide the explanation Next question Try again
Show the explanation Hide the explanation Answer B · 47 47 47
The second 3-year moving average uses 46 , 43 , 52 46, 43, 52 46 , 43 , 52
46 + 43 + 52 3 = 47 \frac{46 + 43 + 52}{3} = 47 3 46 + 43 + 52 = 47
Worth noting
43 is the first 3-year average, of 40, 46 and 43; the second starts one year later.
A time series has values for 9 years. How many 5-year moving averages can be worked out from it?
Options for question 40 A Option A 3 3 3 B Option B 4 4 4 C Option C 5 5 5 D Option D 9 9 9
Skip Check Show the explanation Hide the explanation Next question Try again
Show the explanation Hide the explanation Answer C · 5 5 5
The first covers years 1 to 5, the last years 5 to 9.
Starting years 1 to 5: 9 − 5 + 1 = 5 9 - 5 + 1 = 5 9 − 5 + 1 = 5
Worth noting
4 is 9 − 5 9 - 5 9 − 5
Read the two statements and choose the correct option.
I. A moving average over an even number of years falls between two years, so it has to be centred.
II. A 3-year moving average must also be centred.
Options for question 41 A Option A Only I B Option B Only II C Option C Both I and II D Option D Neither I nor II
Skip Check Show the explanation Hide the explanation Next question Try again
Show the explanation Hide the explanation Answer A · Only I
I: the middle of 4 years lies between the 2nd and 3rd, so pairs of averages are averaged again. True.
II: an odd period has a middle year, so no centring is needed. False.
A hill resort's guests, in hundreds, for the four quarters of two years were: year 1: 12, 30, 8, 20; year 2: 14, 33, 9, 24.
What is the first centred 4-quarter moving average of the resort's guests?
Options for question 42 A Option A 17.5 17.5 17.5 B Option B 17.75 17.75 17.75 C Option C 18 18 18 D Option D 35.5 35.5 35.5
Skip Check Show the explanation Hide the explanation Next question Try again
Show the explanation Hide the explanation Answer B · 17.75 17.75 17.75
The first two 4-quarter totals are 70 and 72.
Centred average = 70 + 72 8 = 17.75 = \frac{70 + 72}{8} = 17.75 = 8 70 + 72 = 17.75
Worth noting
17.5 is the first 4-quarter average, 70 4 \frac{70}{4} 4 70
A hill resort's guests, in hundreds, for the four quarters of two years were: year 1: 12, 30, 8, 20; year 2: 14, 33, 9, 24.
Against which quarter is the resort's first centred moving average placed?
Options for question 43 A Option A The second quarter of year 1 B Option B Between the second and third quarters of year 1 C Option C The fourth quarter of year 1 D Option D The third quarter of year 1
Skip Check Show the explanation Hide the explanation Next question Try again
Show the explanation Hide the explanation Answer D · The third quarter of year 1
The first total, quarters 1–4, centres between quarters 2 and 3; the second, quarters 2–5, between 3 and 4.
Averaging the two lines the result up with quarter 3 of year 1.
Worth noting
Between quarters 2 and 3 is where an uncentred 4-quarter average falls; centring moves it onto a quarter.
A series has the values 10, 14, 12, 18 and 20 for five years. What is the first centred 4-year moving average?
Options for question 44 A Option A 13.5 13.5 13.5 B Option B 14.75 14.75 14.75 C Option C 14.8 14.8 14.8 D Option D 16 16 16
Skip Check Show the explanation Hide the explanation Next question Try again
Show the explanation Hide the explanation Answer B · 14.75 14.75 14.75
The 4-year moving averages are 10 + 14 + 12 + 18 4 = 13.5 \frac{10 + 14 + 12 + 18}{4} = 13.5 4 10 + 14 + 12 + 18 = 13.5 14 + 12 + 18 + 20 4 = 16 \frac{14 + 12 + 18 + 20}{4} = 16 4 14 + 12 + 18 + 20 = 16
Centring averages the two: 13.5 + 16 2 = 14.75 \frac{13.5 + 16}{2} = 14.75 2 13.5 + 16 = 14.75
Worth noting
13.5 is the first uncentred average, which sits between years 2 and 3, against no year.
A series has the values 8, 12, 10, 14 and 18 for five years. What is the first centred 4-year moving average?
Options for question 45 A Option A 11 11 11 B Option B 12.25 12.25 12.25 C Option C 12.4 12.4 12.4 D Option D 13.5 13.5 13.5
Skip Check Show the explanation Hide the explanation Next question Try again
Show the explanation Hide the explanation Answer B · 12.25 12.25 12.25
The 4-year moving averages are 44 4 = 11 \frac{44}{4} = 11 4 44 = 11 54 4 = 13.5 \frac{54}{4} = 13.5 4 54 = 13.5
Centring averages them in pairs: 11 + 13.5 2 = 12.25 \frac{11 + 13.5}{2} = 12.25 2 11 + 13.5 = 12.25
Worth noting
11 is an uncentred 4-year average, lying between the second and third years.
A straight-line trend by least squares 23 questions The trend line for a firm's sales is y = 40 + 3.5 x y = 40 + 3.5x y = 40 + 3.5 x x x x
Options for question 46 A Option A 43.5 43.5 43.5 B Option B 47 47 47 C Option C 54 54 54 D Option D 92.5 92.5 92.5
Skip Check Show the explanation Hide the explanation Next question Try again
Show the explanation Hide the explanation Answer C · 54 54 54
2026 is 4 years after 2022, so x = 4 x = 4 x = 4
y = 40 + 3.5 × 4 = 54 y = 40 + 3.5 \times 4 = 54 y = 40 + 3.5 × 4 = 54
Worth noting
43.5 takes x = 1 x = 1 x = 1
The trend line of a product's sales is y = 85 − 2.5 x y = 85 - 2.5x y = 85 − 2.5 x x x x
Options for question 47 A Option A Sales rise by about 2.5 units a year B Option B Sales fall by about 2.5 units a year C Option C Sales fall by 85 units a year D Option D Sales stay at 85 every year
Skip Check Show the explanation Hide the explanation Next question Try again
Show the explanation Hide the explanation Answer B · Sales fall by about 2.5 units a year
The slope is the change in y y y
− 2.5 -2.5 − 2.5 x = 0 x = 0 x = 0
The trend line of a company's output is y = 120 + 6 x y = 120 + 6x y = 120 + 6 x x = 0 x = 0 x = 0 x x x
Options for question 48 A Option A 108 108 108 B Option B 114 114 114 C Option C 120 120 120 D Option D 132 132 132
Skip Check Show the explanation Hide the explanation Next question Try again
Show the explanation Hide the explanation Answer A · 108 108 108
2019 is 2 years before 2021, so x = − 2 x = -2 x = − 2
y = 120 − 12 = 108 y = 120 - 12 = 108 y = 120 − 12 = 108
Worth noting
132 takes x = + 2 x = +2 x = + 2 x x x
A dealer's scooter sales, in hundreds, were 42, 45, 51, 54 and 60 in the five years 2020 to 2024.
What is the dealer's 3-year moving average placed against 2021?
Options for question 49 A Option A 44 44 44 B Option B 45 45 45 C Option C 46 46 46 D Option D 50 50 50
Skip Check Show the explanation Hide the explanation Next question Try again
Show the explanation Hide the explanation Answer C · 46 46 46
The average placed against 2021 is the mean of 2020, 2021 and 2022.
42 + 45 + 51 3 = 46 \frac{42 + 45 + 51}{3} = 46 3 42 + 45 + 51 = 46
Worth noting
50.4 is the mean of all five years.
A tractor maker fits the trend y = 120 + 6 x y = 120 + 6x y = 120 + 6 x y y y x x x x = 0 x = 0 x = 0
What sales, in thousands, does the tractor maker's trend give for 2026?
Options for question 50 A Option A 126 126 126 B Option B 150 150 150 C Option C 156 156 156 D Option D 162 162 162
Skip Check Show the explanation Hide the explanation Next question Try again
Show the explanation Hide the explanation Answer C · 156 156 156
2026 is x = 6 x = 6 x = 6
y = 120 + 6 ( 6 ) = 156 y = 120 + 6(6) = 156 y = 120 + 6 ( 6 ) = 156
Worth noting
162 takes 2026 as x = 7 x = 7 x = 7
A tractor maker fits the trend y = 120 + 6 x y = 120 + 6x y = 120 + 6 x y y y x x x x = 0 x = 0 x = 0
What does the 6 in the tractor maker's trend y = 120 + 6 x y = 120 + 6x y = 120 + 6 x
Options for question 51 A Option A Sales rise by about 6 thousand tractors a year B Option B Sales rise by 6% a year C Option C Sales were 6 thousand tractors in 2020 D Option D The trend covers 6 years of data
Skip Check Show the explanation Hide the explanation Next question Try again
Show the explanation Hide the explanation Answer A · Sales rise by about 6 thousand tractors a year
6 is the slope: each extra year adds 6 to y y y
y y y
Worth noting
A straight-line trend adds a fixed amount each year, not a fixed percentage.
A dealer's scooter sales, in hundreds, were 42, 45, 51, 54 and 60 in the five years 2020 to 2024.
What is the dealer's 3-year moving average placed against 2023?
Options for question 52 A Option A 50 50 50 B Option B 54 54 54 C Option C 55 55 55 D Option D 57 57 57
Skip Check Show the explanation Hide the explanation Next question Try again
Show the explanation Hide the explanation Answer C · 55 55 55
The average placed against 2023 is the mean of 2022, 2023 and 2024.
51 + 54 + 60 3 = 55 \frac{51 + 54 + 60}{3} = 55 3 51 + 54 + 60 = 55
Worth noting
57 averages only 2023 and 2024; a 3-year average centred on 2023 takes in 2022 too.
A straight-line trend y = a + b x y = a + bx y = a + b x x x x a a a
Options for question 53 A Option A 2.7 2.7 2.7 B Option B 14 14 14 C Option C 15 15 15 D Option D 17 17 17
Skip Check Show the explanation Hide the explanation Next question Try again
Show the explanation Hide the explanation Answer C · 15 15 15
With x x x − 2 , − 1 , 0 , 1 , 2 -2, -1, 0, 1, 2 − 2 , − 1 , 0 , 1 , 2 ∑ x = 0 \sum x = 0 ∑ x = 0 ∑ y = n a + b ∑ x \sum y = na + b\sum x ∑ y = na + b ∑ x ∑ y = n a \sum y = na ∑ y = na
a = ∑ y n = 75 5 = 15 a = \frac{\sum y}{n} = \frac{75}{5} = 15 a = n ∑ y = 5 75 = 15
Worth noting
75 is ∑ y \sum y ∑ y
The trend line for a firm's sales is y = 15 + 2.7 x y = 15 + 2.7x y = 15 + 2.7 x x x x
Options for question 54 A Option A 17.7 17.7 17.7 B Option B 21.6 21.6 21.6 C Option C 25.8 25.8 25.8 D Option D 28.5 28.5 28.5
Skip Check Show the explanation Hide the explanation Next question Try again
Show the explanation Hide the explanation Answer C · 25.8 25.8 25.8
2027 is 4 years after 2023, so x = 4 x = 4 x = 4
y = 15 + 2.7 × 4 = 25.8 y = 15 + 2.7 \times 4 = 25.8 y = 15 + 2.7 × 4 = 25.8
Worth noting
28.5 uses x = 5 x = 5 x = 5
The trend line of a company's output is y = 120 + 8 x y = 120 + 8x y = 120 + 8 x x = 0 x = 0 x = 0 x x x
Options for question 55 A Option A The output in 2020 was 8 units B Option B The output rose 8% a year C Option C The trend line meets the axis at 8 D Option D The trend rises by 8 units every year
Skip Check Show the explanation Hide the explanation Next question Try again
Show the explanation Hide the explanation Answer D · The trend rises by 8 units every year
In y = a + b x y = a + bx y = a + b x b b b x x x
So the trend output rises by 8 units a year; the 120 is the trend value for 2020.
Worth noting
The slope is a fixed amount, not a percentage: a straight-line trend adds the same quantity each year.
The graph shows a firm's sales y y y y = 39.6 + 4.5 x y = 39.6 + 4.5x y = 39.6 + 4.5 x x x x
Options for question 56 A Option A 40.5 40.5 40.5 B Option B 48.6 48.6 48.6 C Option C 283 5 \frac{283}{5} 5 283 D Option D 57.6 57.6 57.6
Skip Check Show the explanation Hide the explanation Next question Try again
Show the explanation Hide the explanation Answer D · 57.6 57.6 57.6
2026 is 4 years after 2022, so x = 4 x = 4 x = 4
y = 39.6 + 4.5 × 4 = 57.6 y = 39.6 + 4.5 \times 4 = 57.6 y = 39.6 + 4.5 × 4 = 57.6
Worth noting
48.6 is the trend value for 2024, the last year shown, not 2026.
When fitting a trend to an odd number of years, why is x x x
Options for question 57 A Option A It makes the slope b b b B Option B It makes ∑ x = 0 \sum x = 0 ∑ x = 0 a = ∑ y n a = \frac{\sum y}{n} a = n ∑ y b = ∑ x y ∑ x 2 b = \frac{\sum xy}{\sum x^{2}} b = ∑ x 2 ∑ x y C Option C It makes every y y y D Option D It is required for the trend to rise
Skip Check Show the explanation Hide the explanation Next question Try again
Show the explanation Hide the explanation Answer B · It makes ∑ x = 0 \sum x = 0 ∑ x = 0 a = ∑ y n a = \frac{\sum y}{n} a = n ∑ y b = ∑ x y ∑ x 2 b = \frac{\sum xy}{\sum x^{2}} b = ∑ x 2 ∑ x y
The normal equations are ∑ y = n a + b ∑ x \sum y = na + b\sum x ∑ y = na + b ∑ x ∑ x y = a ∑ x + b ∑ x 2 \sum xy = a\sum x + b\sum x^{2} ∑ x y = a ∑ x + b ∑ x 2
With ∑ x = 0 \sum x = 0 ∑ x = 0 a = ∑ y n a = \frac{\sum y}{n} a = n ∑ y b = ∑ x y ∑ x 2 b = \frac{\sum xy}{\sum x^{2}} b = ∑ x 2 ∑ x y
For a straight line y = a + b x y = a + bx y = a + b x
I. It makes the sum of the squared vertical distances from the points as small as possible.
II. The deviations of the actual values from the trend values add up to 0.
III. It passes through the point ( x ˉ , y ˉ ) (\bar{x}, \bar{y}) ( x ˉ , y ˉ )
IV. Its slope b b b
Options for question 58 A Option A All four: I, II, III and IV B Option B I and II only C Option C II and III only D Option D I, II and III only
Skip Check Show the explanation Hide the explanation Next question Try again
Show the explanation Hide the explanation Answer D · I, II and III only
I is what 'least squares' means. II and III follow from the first normal equation, ∑ y = n a + b ∑ x \sum y = na + b\sum x ∑ y = na + b ∑ x
IV is false: a falling series gives a negative slope.
A straight-line trend y = a + b x y = a + bx y = a + b x x x x a a a
Options for question 59 A Option A 4.3 4.3 4.3 B Option B 36 36 36 C Option C 37 37 37 D Option D 38 38 38
Skip Check Show the explanation Hide the explanation Next question Try again
Show the explanation Hide the explanation Answer D · 38 38 38
With x = − 2 , − 1 , 0 , 1 , 2 x = -2, -1, 0, 1, 2 x = − 2 , − 1 , 0 , 1 , 2 ∑ x = 0 \sum x = 0 ∑ x = 0 a = ∑ y n a = \frac{\sum y}{n} a = n ∑ y
a = 190 5 = 38 a = \frac{190}{5} = 38 a = 5 190 = 38
Worth noting
37 is the 2022 value itself; a a a
The trend line of a town's population, in thousands, is y = 25 + 1.8 x y = 25 + 1.8x y = 25 + 1.8 x x x x
Options for question 60 A Option A 19.6 19.6 19.6 B Option B 23.2 23.2 23.2 C Option C 25 25 25 D Option D 30.4 30.4 30.4
Skip Check Show the explanation Hide the explanation Next question Try again
Show the explanation Hide the explanation Answer A · 19.6 19.6 19.6
2020 is 3 years before 2023, so x = − 3 x = -3 x = − 3
y = 25 − 5.4 = 19.6 y = 25 - 5.4 = 19.6 y = 25 − 5.4 = 19.6
Worth noting
30.4 uses x = + 3 x = +3 x = + 3
A dealer's scooter sales, in hundreds, were 42, 45, 51, 54 and 60 in the five years 2020 to 2024.
Fitting a straight-line trend by least squares, with x = 0 x = 0 x = 0 x x x
Options for question 61 A Option A 7 2 \frac{7}{2} 2 7 B Option B 4.5 4.5 4.5 C Option C 45 45 45 D Option D 50.4 50.4 50.4
Skip Check Show the explanation Hide the explanation Next question Try again
Show the explanation Hide the explanation Answer B · 4.5 4.5 4.5
x = − 2 , − 1 , 0 , 1 , 2 x = -2, -1, 0, 1, 2 x = − 2 , − 1 , 0 , 1 , 2 ∑ x y = − 84 − 45 + 0 + 54 + 120 = 45 \sum xy = -84 - 45 + 0 + 54 + 120 = 45 ∑ x y = − 84 − 45 + 0 + 54 + 120 = 45 ∑ x 2 = 10 \sum x^{2} = 10 ∑ x 2 = 10
b = ∑ x y ∑ x 2 = 45 10 = 4.5 b = \frac{\sum xy}{\sum x^{2}} = \frac{45}{10} = 4.5 b = ∑ x 2 ∑ x y = 10 45 = 4.5
Worth noting
45 is ∑ x y \sum xy ∑ x y ∑ x 2 = 10 \sum x^{2} = 10 ∑ x 2 = 10
A tractor maker fits the trend y = 120 + 6 x y = 120 + 6x y = 120 + 6 x y y y x x x x = 0 x = 0 x = 0
In which year does the tractor maker's trend reach sales of 180 thousand?
Options for question 62 A Option A 2029 B Option B 2030 C Option C 2040 D Option D 2050
Skip Check Show the explanation Hide the explanation Next question Try again
Show the explanation Hide the explanation Answer B · 2030
120 + 6 x = 180 ⇒ x = 10 120 + 6x = 180 \Rightarrow x = 10 120 + 6 x = 180 ⇒ x = 10
x = 10 x = 10 x = 10
Worth noting
2050 adds the 30 of 180 6 \frac{180}{6} 6 180
A tractor maker fits the trend y = 120 + 6 x y = 120 + 6x y = 120 + 6 x y y y x x x x = 0 x = 0 x = 0
The tractor maker actually sold 150 thousand in 2024. What does the gap between this and the trend show?
Options for question 63 A Option A The trend is wrong and must be refitted B Option B Sales were 6 thousand below trend C Option C The long-run trend has risen to 150 D Option D Sales were 6 thousand above trend, from short-term movements
Skip Check Show the explanation Hide the explanation Next question Try again
Show the explanation Hide the explanation Answer D · Sales were 6 thousand above trend, from short-term movements
2024 is x = 4 x = 4 x = 4 120 + 24 = 144 120 + 24 = 144 120 + 24 = 144
150 − 144 = 6 150 - 144 = 6 150 − 144 = 6
Worth noting
A single year off the line does not make the trend wrong; real values scatter around it.
For the same sales 10, 12, 15, 17 and 21 (2021 to 2025, x x x b b b
Options for question 64 A Option A 17 10 \frac{17}{10} 10 17 B Option B 1.8 1.8 1.8 C Option C 2.7 2.7 2.7 D Option D 5.4 5.4 5.4
Skip Check Show the explanation Hide the explanation Next question Try again
Show the explanation Hide the explanation Answer C · 2.7 2.7 2.7
With ∑ x = 0 \sum x = 0 ∑ x = 0 b = ∑ x y ∑ x 2 b = \frac{\sum xy}{\sum x^{2}} b = ∑ x 2 ∑ x y ∑ x y = − 20 − 12 + 0 + 17 + 42 = 27 \sum xy = -20 - 12 + 0 + 17 + 42 = 27 ∑ x y = − 20 − 12 + 0 + 17 + 42 = 27 ∑ x 2 = 4 + 1 + 0 + 1 + 4 = 10 \sum x^{2} = 4 + 1 + 0 + 1 + 4 = 10 ∑ x 2 = 4 + 1 + 0 + 1 + 4 = 10
b = 27 10 = 2.7 b = \frac{27}{10} = 2.7 b = 10 27 = 2.7
Worth noting
5.4 divides ∑ x y \sum xy ∑ x y n = 5 n = 5 n = 5 ∑ x 2 = 10 \sum x^{2} = 10 ∑ x 2 = 10
Which pair of normal equations gives a a a b b b y = a + b x y = a + bx y = a + b x n n n
Options for question 65 A Option A ∑ y = a + b ∑ x \sum y = a + b\sum x ∑ y = a + b ∑ x ∑ x y = a ∑ x + b ∑ x 2 \sum xy = a\sum x + b\sum x^{2} ∑ x y = a ∑ x + b ∑ x 2 B Option B ∑ y = n a + b ∑ x \sum y = na + b\sum x ∑ y = na + b ∑ x ∑ x y = n a + b ∑ x 2 \sum xy = na + b\sum x^{2} ∑ x y = na + b ∑ x 2 C Option C ∑ x = n a + b ∑ y \sum x = na + b\sum y ∑ x = na + b ∑ y ∑ x y = a ∑ y + b ∑ y 2 \sum xy = a\sum y + b\sum y^{2} ∑ x y = a ∑ y + b ∑ y 2 D Option D ∑ y = n a + b ∑ x \sum y = na + b\sum x ∑ y = na + b ∑ x ∑ x y = a ∑ x + b ∑ x 2 \sum xy = a\sum x + b\sum x^{2} ∑ x y = a ∑ x + b ∑ x 2
Skip Check Show the explanation Hide the explanation Next question Try again
Show the explanation Hide the explanation Answer D · ∑ y = n a + b ∑ x \sum y = na + b\sum x ∑ y = na + b ∑ x ∑ x y = a ∑ x + b ∑ x 2 \sum xy = a\sum x + b\sum x^{2} ∑ x y = a ∑ x + b ∑ x 2
Summing y = a + b x y = a + bx y = a + b x n n n ∑ y = n a + b ∑ x \sum y = na + b\sum x ∑ y = na + b ∑ x
Multiplying by x x x ∑ x y = a ∑ x + b ∑ x 2 \sum xy = a\sum x + b\sum x^{2} ∑ x y = a ∑ x + b ∑ x 2
Worth noting
The second pair writes ∑ y = a + b ∑ x \sum y = a + b\sum x ∑ y = a + b ∑ x a a a n n n n a na na a a a
A straight-line trend, with x x x
Options for question 66 A Option A y = 50 + 4 x y = 50 + 4x y = 50 + 4 x B Option B y = 58 + 16 x y = 58 + 16x y = 58 + 16 x C Option C y = 58 + 8 x y = 58 + 8x y = 58 + 8 x D Option D y = 58 + 4 x y = 58 + 4x y = 58 + 4 x
Skip Check Show the explanation Hide the explanation Next question Try again
Show the explanation Hide the explanation Answer D · y = 58 + 4 x y = 58 + 4x y = 58 + 4 x
At 2020, x = − 2 x = -2 x = − 2 a − 2 b = 50 a - 2b = 50 a − 2 b = 50 x = 2 x = 2 x = 2 a + 2 b = 66 a + 2b = 66 a + 2 b = 66
Adding: a = 58 a = 58 a = 58 4 b = 16 4b = 16 4 b = 16 b = 4 b = 4 b = 4
Worth noting
y = 50 + 4 x y = 50 + 4x y = 50 + 4 x x = 0 x = 0 x = 0
For the same output 30, 34, 37, 41 and 48 (2020 to 2024, x x x b b b
Options for question 67 A Option A 4.3 4.3 4.3 B Option B 4.5 4.5 4.5 C Option C 8.6 8.6 8.6 D Option D 38 38 38
Skip Check Show the explanation Hide the explanation Next question Try again
Show the explanation Hide the explanation Answer A · 4.3 4.3 4.3
∑ x y = − 60 − 34 + 0 + 41 + 96 = 43 \sum xy = -60 - 34 + 0 + 41 + 96 = 43 ∑ x y = − 60 − 34 + 0 + 41 + 96 = 43 ∑ x 2 = 10 \sum x^{2} = 10 ∑ x 2 = 10
b = 43 10 = 4.3 b = \frac{43}{10} = 4.3 b = 10 43 = 4.3
Worth noting
8.6 divides by n = 5 n = 5 n = 5 ∑ x 2 = 10 \sum x^{2} = 10 ∑ x 2 = 10
A dealer's scooter sales, in hundreds, were 42, 45, 51, 54 and 60 in the five years 2020 to 2024.
Using the dealer's least-squares trend, what are the expected sales, in hundreds, for 2025?
Options for question 68 A Option A 54.9 54.9 54.9 B Option B 59.4 59.4 59.4 C Option C 63.9 63.9 63.9 D Option D 64.5 64.5 64.5
Skip Check Show the explanation Hide the explanation Back to start Try again
Show the explanation Hide the explanation Answer C · 63.9 63.9 63.9
a = 252 5 = 50.4 a = \frac{252}{5} = 50.4 a = 5 252 = 50.4 y = 50.4 + 4.5 x y = 50.4 + 4.5x y = 50.4 + 4.5 x
2025 is x = 3 x = 3 x = 3 50.4 + 13.5 = 63.9 50.4 + 13.5 = 63.9 50.4 + 13.5 = 63.9
Worth noting
64.5 adds the slope to 2024's actual sales; the forecast comes from the line, not the last value.
Question types · easy to hard
NTA's Mathematics / Applied Mathematics syllabus has three sections: Section A1, which every candidate answers, then Section B1 (Mathematics) or Section B2 (Applied Mathematics), of which a candidate answers one. Each section lists units and topics but no chapters, so the chapters here are ours. Where both B sections list a topic that Section A also lists, its questions sit once, in Section A.