EduFarming
Your list · 0हिं

Type at least two letters. Press Esc to close.

↑↓ navigate↵ openTAB cycle filter

Time Series & Trend · Question 56 of 68

The graph shows a firm's sales y, in lakh rupees, for 2020 to 2024, with the least-squares trend line y =…

Question 56

MediumOriginal question

The graph shows a firm's sales yy, in lakh rupees, for 2020 to 2024, with the least-squares trend line y=39.6+4.5xy = 39.6 + 4.5x, where xx is measured in years from 2022. What trend value does the line give for 2026?
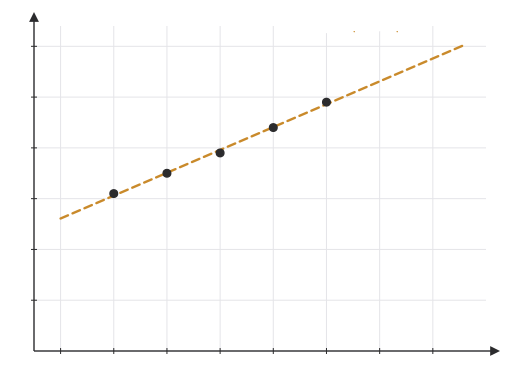
Sales for 2020 to 2024 plotted as points (31, 35, 39, 44 and 49) with a dashed rising trend line labelled y = 39.6 + 4.5x running on to 2026.
Options for question 56

Show the answer and explanation
CorrectNot quiteAnswer D

Correct answer: D

Explanation

  1. 2026 is 4 years after 2022, so x=4x = 4.

  2. y=39.6+4.5×4=57.6y = 39.6 + 4.5 \times 4 = 57.6 lakh rupees.

Worth noting

48.6 is the trend value for 2024, the last year shown, not 2026.

Concept
Reading a trend line
Typical time
90 s
Your time
—
The rule this testsA straight-line trend by least squares
Practise this chapter →

Ten questions from Time Series & Trend, at your own pace.

Practise this chapter →

Ten questions from Time Series & Trend, at your own pace.