EduFarming
Your list · 0हिं

Type at least two letters. Press Esc to close.

↑↓ navigate↵ openTAB cycle filter

Employment: Formal & Informal Work · Question 30 of 58

The graph shows an economy's GDP and employment as indices over ten years.

Question 30

MediumOriginal question

The graph shows an economy's GDP and employment as indices over ten years. By what per cent did each grow?
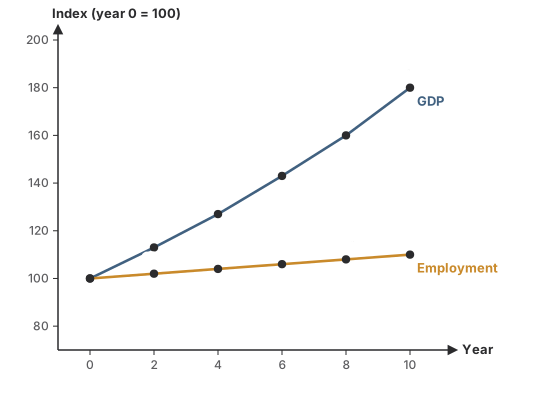
A line graph of an economy's GDP and employment as indices, year 0 = 100. GDP: 100, 113, 127, 143, 160, 180 in years 0, 2, 4, 6, 8, 10. Employment: 100, 102, 104, 106, 108, 110.
Options for question 30

Show the answer and explanation
CorrectNot quiteAnswer B

Correct answer: B

Explanation

  1. GDP: 180 − 100 = 80, so 80%.

  2. Employment: 110 − 100 = 10, so 10%.

Worth noting

An index of 180 means 180% of the starting level, a rise of 80%, not 180%.

Concept
Reading an index
Typical time
70 s
Your time
—
The rule this testsJobless growth and casualisation
Practise this chapter →

Ten questions from Employment: Formal & Informal Work, at your own pace.

Practise this chapter →

Ten questions from Employment: Formal & Informal Work, at your own pace.