Question 12
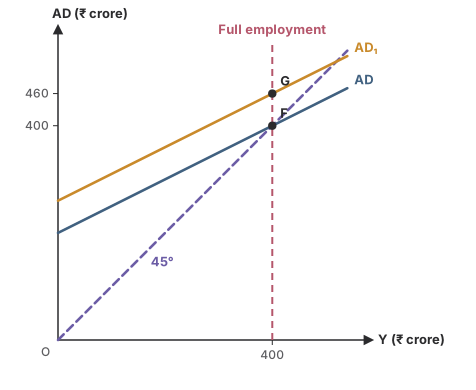
MediumOriginal questionThe graph shows AD₁ above AD at the full-employment income. The inflationary gap is
Show the answer and explanation
CorrectNot quiteAnswer A
Correct answer: A
Explanation
At the full-employment income of 400, AD₁ = 460 (point G) while full-employment output is 400 (point F).
Gap = 460 − 400 = ₹60 crore.
Worth noting
₹120 crore would be the multiplied effect on money income; the gap itself is the vertical distance at full employment.
- Concept
- Reading the inflationary gap
- Typical timeTypical
- 70 s
- Your timeYours
- —
Practise this chapter →
Ten questions from Excess & Deficient Demand, at your own pace.