Question 22
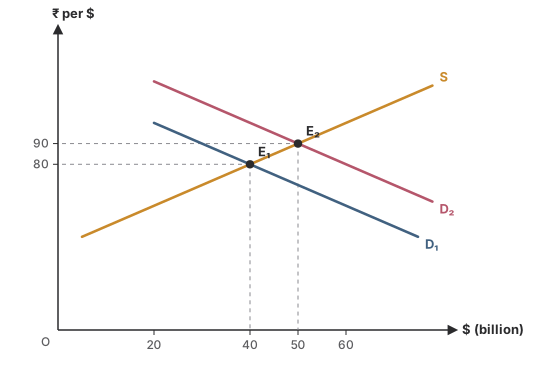
MediumOriginal questionThe graph shows the demand for dollars rising from D₁ to D₂. What happens to the rupee?
Show the answer and explanation
CorrectNot quiteAnswer D
Correct answer: D
Explanation
Equilibrium moves from E₁ (₹80) to E₂ (₹90).
More rupees per dollar means the rupee has depreciated.
Worth noting
40 and 50 are quantities of dollars, in billions, read off the horizontal axis, not exchange rates.
- Concept
- Rise in demand for dollars
- Typical timeTypical
- 70 s
- Your timeYours
- —
Practise this chapter →
Ten questions from Foreign Exchange Rate, at your own pace.