EduFarming
Your list · 0हिं

Type at least two letters. Press Esc to close.

↑↓ navigate↵ openTAB cycle filter

Foreign Exchange Rate · Question 23 of 50

The graph shows the demand for dollars rising from D₁ to D₂.

Question 23

MediumOriginal question

The graph shows the demand for dollars rising from D₁ to D₂. Which event could cause this shift?
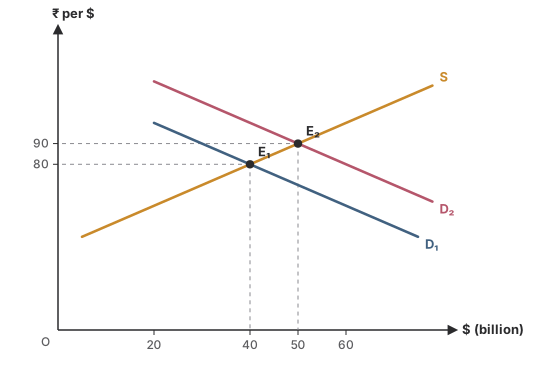
The demand for dollars shifts right from D₁ to D₂ while supply S stays put. Equilibrium moves from E₁ (₹80 per dollar, $40 billion) to E₂ (₹90 per dollar, $50 billion).
Options for question 23

Show the answer and explanation
CorrectNot quiteAnswer C

Correct answer: C

Explanation

  1. A costlier oil bill means importers need more dollars at every exchange rate: demand shifts right.

  2. The other three add to the supply of dollars.

Concept
What shifts demand for forex
Typical time
70 s
Your time
—
The rule this testsThe flexible rate: depreciation and appreciation
Practise this chapter →

Ten questions from Foreign Exchange Rate, at your own pace.

Practise this chapter →

Ten questions from Foreign Exchange Rate, at your own pace.