EduFarming
Your list · 0हिं

Type at least two letters. Press Esc to close.

↑↓ navigate↵ openTAB cycle filter

Venn Diagrams · Question 37 of 65

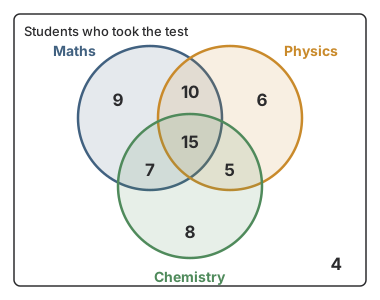
According to the test results diagram, how many students failed in Maths?
Question 37

MediumOriginal question

According to the test results diagram, how many students failed in Maths?

Venn diagram of three overlapping circles labelled Maths, Physics and Chemistry inside a box labelled Students who took the test. Only Maths: 9. Only Physics: 6. Only Chemistry: 8. Maths and Physics only: 10. Maths and Chemistry only: 7. Physics and Chemistry only: 5. All three: 15. Outside all three: 4.
Options for question 37

Show the answer and explanation
CorrectNot quiteAnswer B

Correct answer: B

Explanation

  1. Total students =9+6+8+10+7+5+15+4=64= 9 + 6 + 8 + 10 + 7 + 5 + 15 + 4 = 64.

  2. Passed Maths =9+10+7+15=41= 9 + 10 + 7 + 15 = 41.

  3. Failed Maths =64−41=23= 64 - 41 = 23. (Check: 6+8+5+4=236 + 8 + 5 + 4 = 23.)

Worth noting

19 forgets the 4 students outside every circle, who failed all three subjects, Maths included. 41 is the number who PASSED Maths.

Concept
Complement inside the universe
Typical time
70 s
Your time
—
The rule this testsReading a labelled diagram
Practise this chapter →

Ten questions from Venn Diagrams, at your own pace.

Practise this chapter →

Ten questions from Venn Diagrams, at your own pace.