EduFarming
Your list · 0हिं

Type at least two letters. Press Esc to close.

↑↓ navigate↵ openTAB cycle filter

Consumer & Producer Surplus · Question 58 of 70

The figure shows the supply curve p = 4 + 2x and the market price ₹20.

Question 58

MediumOriginal question

The figure shows the supply curve p=4+2xp = 4 + 2x and the market price ₹20. What is the area of the shaded region, the producer surplus?
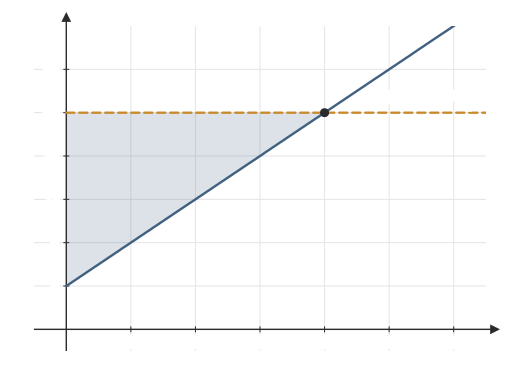
Supply curve p = 4 + 2x rising from (0, 4), a dashed price line p = 20, meeting at (8, 20); the triangle between the price line and the curve from x = 0 to 8 is shaded.
Options for question 58

Show the answer and explanation
CorrectNot quiteAnswer A

Correct answer: A

Explanation

  1. The price line meets the supply curve where 4+2x=204 + 2x = 20, at x0=8x_0 = 8.

  2. The shaded triangle has base 8 and height 20−4=1620 - 4 = 16: area 12×8×16=64\frac{1}{2} \times 8 \times 16 = 64 rupees.

Worth noting

₹96 is the area under the supply curve, ∫08(4+2x) dx\int_{0}^{8} (4 + 2x)\,dx, not the region above it.

Concept
Reading producer surplus from a figure
Typical time
90 s
Your time
—
The rule this testsProducer surplus
Practise this chapter →

Ten questions from Consumer & Producer Surplus, at your own pace.

Practise this chapter →

Ten questions from Consumer & Producer Surplus, at your own pace.