EduFarming
Your list · 0हिं

Type at least two letters. Press Esc to close.

↑↓ navigate↵ openTAB cycle filter

Inverse Trigonometric Functions · Question 74 of 120

The figure shows the graph of a function defined for every real x, falling through (0, π/2) between the…

Question 74

MediumOriginal question

The figure shows the graph of a function defined for every real xx, falling through (0,π2)\left(0, \frac{\pi}{2}\right) between the lines y=0y = 0 and y=πy = \pi without reaching them. Which function is it?
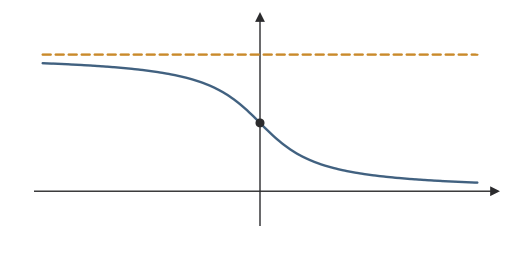
A curve falling through (0, π/2) between the x-axis and the dashed line y = π
Options for question 74

Show the answer and explanation
CorrectNot quiteAnswer D

Correct answer: D

Explanation

  1. Defined everywhere, with values in (0,π)(0, \pi), and falling: that is cot⁡−1\cot^{-1}.

  2. It crosses the yy-axis at cot⁡−10=π2\cot^{-1} 0 = \frac{\pi}{2}.

Worth noting

π2+tan⁡−1x\frac{\pi}{2} + \tan^{-1} x has the same range, but it rises.

Concept
Recognising an inverse function from its graph
Typical time
90 s
Your time
—
The rule this testsGraphs of the inverse functions
Practise this chapter →

Ten questions from Inverse Trigonometric Functions, at your own pace.

Practise this chapter →

Ten questions from Inverse Trigonometric Functions, at your own pace.